
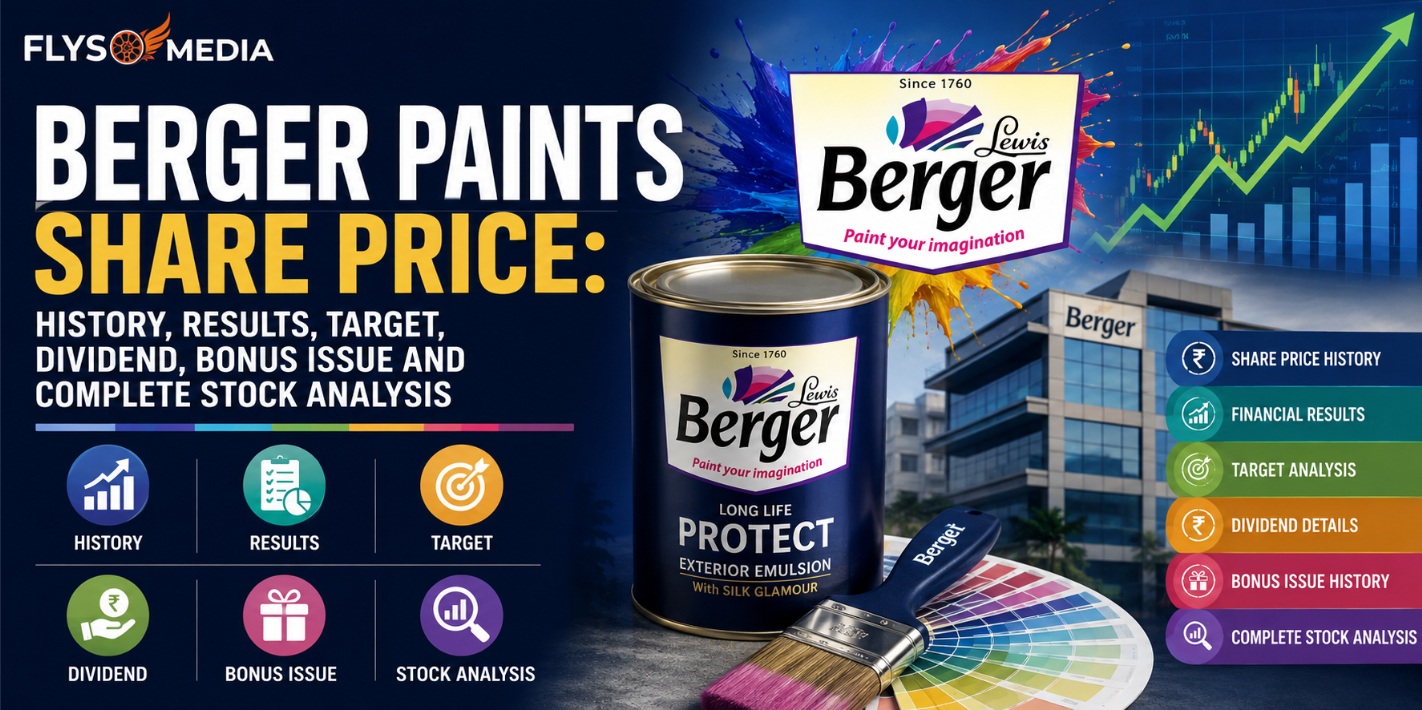
A complete look at Berger Paints share price, company fundamentals, quarterly results, historical returns, dividend record, bonus history, broker targets, risks, and future outlook.
- Berger Paints Share Price Today
- About Berger Paints India Limited
- Berger Paints Share Price History From 1990 to 2026
- Berger Paints Historical Returns and Wealth Creation
- Berger Paints Q1 Results Analysis
- Berger Paints Q3 Results Analysis
- Berger Paints Q4 Results Analysis
- Berger Paints Dividend, Bonus Issue and Stock Split History
- Berger Paints Shareholding Pattern
- Berger Paints Financial Analysis
- Berger Paints Business Model and Growth Drivers
- Berger Paints vs Asian Paints vs Kansai Nerolac vs Akzo Nobel
- Berger Paints Share Price Target and Brokerage View
- Risks That Can Affect Berger Paints Share Price
- Is Berger Paints a Good Stock to Buy?
- FAQs About Berger Paints Share Price
- Final Verdict on Berger Paints Share Price
If you’ve been tracking paint stocks lately, the Berger Paints share price probably caught your eye. It’s one of those quietly consistent names that long-term investors love. Let’s break down everything, step by step, in plain language.
Berger Paints Share Price Today
The Berger Paints share price recently traded around ₹542.10, with a previous close of ₹530.55. During the session it moved between ₹530.80 and ₹543.50. So there’s a healthy, active trading range here.
Latest live price, open, high, low and previous close
Here’s the thing about the daily movement: it’s fairly steady for a large-cap. The stock listed on both NSE (BERGEPAINT) and BSE (509480) sees decent volume, so getting in and out is easy.
52-week high, 52-week low and current market trend
Over the past year, Berger Paints traded between a 52-week low of ₹391.10 and a 52-week high of ₹594.55. The six-month change sits around +12.31%, while the one-year figure hovers near flat (-2.82% to -0.17%). What’s interesting is how the stock bounced strongly off its lows.
|
Metric |
Value |
|---|---|
|
Live price |
₹542.10 |
|
Previous close |
₹530.55 |
|
Day range |
₹530.80 – ₹543.50 |
|
52-week range |
₹391.10 – ₹594.55 |
|
6-month change |
+12.31% |
About Berger Paints India Limited
Berger Paints India Limited is a warm, familiar name in almost every Indian home. Founded back in 1923 and headquartered in Kolkata, it’s grown into a giant in paints, coatings, waterproofing, and construction chemicals.
Company history and evolution from Hadfield’s India to Berger Paints
The story starts with Hadfield’s India Limited, later becoming British Paints India, and eventually the Berger name we know today. The Dhingra brothers, through U K Paints, took the reins and steered decades of steady growth.
Why Berger Paints is the second-largest paint company in India
To be honest, being second only to Asian Paints is no small feat. A strong brand, wide distribution, and constant product innovation keep Berger firmly in the market-leader club. Abhijit Roy has led the company as MD & CEO through much of its recent expansion.


|
Detail |
Info |
|---|---|
|
Company |
Berger Paints India Limited |
|
Founded |
1923 |
|
Headquarters |
Kolkata |
|
Ticker |
BERGEPAINT |
|
ISIN |
INE463A01038 |
Berger Paints Share Price History From 1990 to 2026
The long-term chart is where Berger Paints really shines.
Long-term stock price journey
From tiny single-digit levels in the 1990s to yearly averages like ₹484.46 (2022), ₹604.65 (2023), ₹448.55 (2024), and ₹536.54 (2025), the Berger Paints share price has climbed the wall of worry beautifully.
All-time high, all-time low and major turning points
The all-time high touched ₹727.46 in July 2021. The all-time low, adjusted for splits and bonuses, sits near ₹0.45. That gap tells the whole wealth-creation story in one line.
|
Year |
Approx. Price |
|---|---|
|
2021 |
₹643.12 |
|
2022 |
₹484.46 |
|
2023 |
₹604.65 |
|
2024 |
₹448.55 |
|
2025 |
₹536.54 |
|
All-time high |
₹727.46 |
Berger Paints Historical Returns and Wealth Creation
This part is genuinely fun to look at.
CAGR over 5, 10, 15 and 20 years
Berger has delivered strong compounding — roughly 21.7% CAGR since 1990, with a 10-year return near 126.9%, 15-year around 986.3%, and 20-year near 2581.9%. Those are the kind of numbers that build real portfolios.
What a ₹10,000 investment in Berger Paints would be worth today
Here’s the jaw-dropper: ₹10,000 invested in 1990 would be worth about ₹1.18 crore by 2026, a total return near 117536.4%. Patience clearly paid off.
|
Period |
Return |
|---|---|
|
Long-term CAGR |
21.7% |
|
10-year |
126.9% |
|
15-year |
986.3% |
|
20-year |
2581.9% |
|
₹10,000 (1990) |
₹1.18 crore |
Berger Paints Q1 Results Analysis
Revenue, net profit, EBITDA and margin performance
In Q1 FY24, Berger posted net profit of ₹354.35 crore on revenue of ₹3,029.5 crore, with EBITDA of ₹556.7 crore. Gross margin came in at a healthy 39.8%.
Volume growth, gross margin expansion and management commentary
Volume growth hit 13.7%, which is excellent for the paint industry. Recent quarterly data points to EPS near ₹3.50 and steady net income around ₹4.04 billion. Management keeps talking about market share gains and margin support.
|
Q1 Metric |
Value |
|---|---|
|
Net profit |
₹354.35 crore |
|
Revenue |
₹3,029.5 crore |
|
EBITDA |
₹556.7 crore |
|
Gross margin |
39.8% |
|
Volume growth |
13.7% |
Berger Paints Q3 Results Analysis
Why Berger Paints share price rose after Q3 earnings
After Q3 FY24, the stock jumped up to 4.03%, touching an intraday high of ₹578.25. Investors loved the profit surprise.
Revenue growth, EBITDA trends and profit performance
Net profit rose 49% YoY to ₹300.16 crore, revenue grew 7% to ₹2,881.83 crore, and EBITDA landed near ₹480 crore. In Q3 FY25, profit stayed steady near ₹295.97 crore with 7.4% decorative volume growth.
|
Q3 Metric |
Value |
|---|---|
|
Net profit |
₹300.16 crore |
|
Revenue |
₹2,881.83 crore |
|
EBITDA |
₹480 crore |
|
Profit growth |
49% YoY |
|
Share reaction |
+4.03% |
Berger Paints Q4 Results Analysis
Profit jump, dividend recommendation and price hike impact
Q4 was a stunner. Profit after tax jumped about 27.75% to ₹334.77 crore, and the Berger Paints share price rose over 9% in one session. The board also recommended a ₹4 per share dividend.
Volume growth, product mix and margin guidance
Volume growth hit a strong 11.8%, backed by price hikes of 11–12%. Management guided for a 15–17% EBITDA margin going forward.
|
Q4 Metric |
Value |
|---|---|
|
PAT |
₹334.77 crore |
|
Profit growth |
~27.75% |
|
Revenue |
₹2,868.03 crore |
|
Volume growth |
11.8% |
|
Dividend |
₹4/share |
Berger Paints Dividend, Bonus Issue and Stock Split History
1:5 bonus issue explained
Berger has rewarded shareholders with a 1:5 bonus issue, meaning one extra share for every five held. Over the years it has done 7 bonus issues and 2 stock splits.
Dividend per share trend and shareholder returns
Dividends have trended up nicely — ₹2.8, then ₹3.1, ₹3.2, and recently ₹4 per share. What’s remarkable is that 100 original shares ballooned to roughly 17,740 shares through splits and bonuses!
|
Corporate Action |
Detail |
|---|---|
|
Bonus issue |
1:5 |
|
Total bonuses |
7 |
|
Stock splits |
2 |
|
Recent dividend |
₹4/share |
Berger Paints Shareholding Pattern
Promoter holding, FII, DII, mutual funds and retail stake
Promoters hold a big, confident 74.98%. FIIs own about 4.83%, other DIIs 4.78%, mutual funds 7.01%, and retail plus others roughly 8.40%.
What shareholding trends say about investor confidence
That high promoter stake is reassuring. It signals the family is fully committed to the long game.
|
Holder |
Stake |
|---|---|
|
Promoters |
74.98% |
|
FII |
4.83% |
|
DII |
4.78% |
|
Mutual funds |
7.01% |
|
Retail & others |
8.40% |
Berger Paints Financial Analysis
Revenue, net profit, EBITDA and margin trends
Berger runs a clean, profitable business with net margin near 10.51% and operating margin around 17.56%. Return ratios are strong.
P/E, P/B, ROE, ROCE, EV/EBITDA and dividend yield
The P/E sits high at around 50.76, P/B near 8.94, ROE at 16.29%, and ROCE at a healthy 20.30%. Dividend yield is modest at 0.75%.
|
Ratio |
Value |
|---|---|
|
Market cap |
₹61,844.8 crore |
|
P/E |
~50.76 |
|
ROE |
16.29% |
|
ROCE |
20.30% |
|
EV/EBITDA |
~30.12 |
Berger Paints Business Model and Growth Drivers
Decorative paints, waterproofing, industrial coatings and construction chemicals
Berger earns from decorative paints, waterproofing, industrial coatings, and construction chemicals. Premiumization keeps margins healthy.
Distribution network, retail touchpoints and capacity expansion
The company boasts around 60,000 retail touchpoints and roughly 1,300 color bank machines. Softening crude prices and rural recovery are big tailwinds.
|
Growth Driver |
Note |
|---|---|
|
Retail touchpoints |
~60,000 |
|
Color bank machines |
~1,300 |
|
Segments |
Decorative, industrial, waterproofing |
|
Tailwind |
Softer raw material costs |
Berger Paints vs Asian Paints vs Kansai Nerolac vs Akzo Nobel
Market share comparison
Asian Paints leads the pack, but Berger holds firm second with roughly 19–20% market share. Kansai Nerolac and Akzo Nobel India follow.
Valuation, profitability and growth comparison
Berger’s premium valuation matches its consistent growth. Newer entrants like JSW Paints and Grasim are pushing hard with heavy capex, so competition is heating up.
|
Company |
Position |
|---|---|
|
Asian Paints |
Market leader |
|
Berger Paints |
2nd largest |
|
Kansai Nerolac |
3rd |
|
Akzo Nobel |
4th |
Berger Paints Share Price Target and Brokerage View
HSBC, Nuvama, Elara, Morgan Stanley, Macquarie and other target prices
Brokers are split. HSBC says Buy with a ₹650 target, Nuvama Buy at ₹635, Systematix Buy at ₹625, Elara Accumulate at ₹553. On the cautious side, Morgan Stanley sits Underweight at ₹471, and Macquarie Underperform between ₹400–520.
Bullish, neutral and bearish scenarios for the stock
Bulls see margin expansion and volume recovery. Bears worry about the rich valuation and rising competition.
|
Broker |
Rating |
Target |
|---|---|---|
|
HSBC |
Buy |
₹650 |
|
Nuvama |
Buy |
₹635 |
|
Elara |
Accumulate |
₹553 |
|
Morgan Stanley |
Underweight |
₹471 |
|
Macquarie |
Underperform |
₹400–520 |
Risks That Can Affect Berger Paints Share Price
Raw material inflation, crude oil prices and forex volatility
Paint is crude-linked, so oil spikes hurt margins. Forex swings and monomer price jumps add pressure too.
Competition, pricing pressure and demand slowdown
Muted urban demand, aggressive new players, and weak rural spending are the main worries.
|
Risk |
Impact |
|---|---|
|
Crude oil rise |
Margin squeeze |
|
New competition |
Market share pressure |
|
Weak demand |
Slower volume growth |
Is Berger Paints a Good Stock to Buy?
Long-term investment view
For patient investors, Berger has been a fantastic compounder. Strong brand, high promoter holding, and consistent dividends make it a solid portfolio stock.
Short-term trading view based on earnings and price action
Short term, the Berger Paints share price tends to react sharply to quarterly results. Watch support near ₹391 and resistance around ₹594.
FAQs About Berger Paints Share Price
What is Berger Paints share price today?
The Berger Paints share price recently traded around ₹542.10.
What is the 52-week high and low of Berger Paints?
The 52-week high is ₹594.55 and the low is ₹391.10.
What is the market cap of Berger Paints?
Market cap is roughly ₹61,844.8 crore.
Does Berger Paints give dividend?
Yes! It recently recommended ₹4 per share.
What is the bonus history of Berger Paints?
Berger has issued 7 bonuses, including a 1:5 bonus, plus 2 stock splits.
What are the broker target prices for Berger Paints?
Targets range from ₹400 (Macquarie) to ₹650 (HSBC).
Final Verdict on Berger Paints Share Price
Key takeaways for investors
The Berger Paints share price story is one of steady, reliable wealth creation. Strong fundamentals, a trusted brand, and generous long-term returns make it a favorite for patient investors.
What to watch in upcoming quarters
Keep an eye on volume growth, raw material costs, and margin guidance. If demand recovers and crude stays soft, the next chapter could be a great one.
For More Information Visit: Flys Media